2.3 Correlational Studies: Looking for Relationships
In descriptive research, psychologists often want to know whether two or more phenomena are related and, if so, how strongly. Are students' grade point averages related to the number of hours they spend watching television, playing video games, or texting? To find out, a psychologist would perform a correlational study.
Measuring Correlations
The word correlation is often used as a synonym for “relationship,” which is why a correlational study examines the extent to which two things are related to one another. Technically, however, a correlation is a numerical measure of the strength of the relationship between two things. The “things” may be events, scores, or anything else that can be recorded and tallied. In psychological studies, such things are called variables because they can vary in quantifiable ways. Height, weight, age, income, IQ scores, number of items recalled on a memory test, number of smiles in a given time period—anything that can be measured, rated, or scored can serve as a variable.
A positive correlation means that high values of one variable are associated with high values of the other and that low values of one variable are associated with low values of the other. Height and weight are positively correlated; so are IQ scores and school grades. Rarely is a correlation perfect, however. Some tall people weigh less than some short ones; some people with average IQs are academic superstars and some with high IQs get poor grades. Figure2.5a shows a positive correlation between scores on a psychology exam and the average number of boiled kumquats eaten per month by students. (Obviously, we made this up.) Each dot represents a student; you can find each student's score by drawing a horizontal line from the person's dot to the vertical axis. You can find the number of kumquats a student ate by drawing a vertical line from the student's dot to the horizontal axis. In general, the more kumquats, the higher the score.
Figure2.5
Correlations
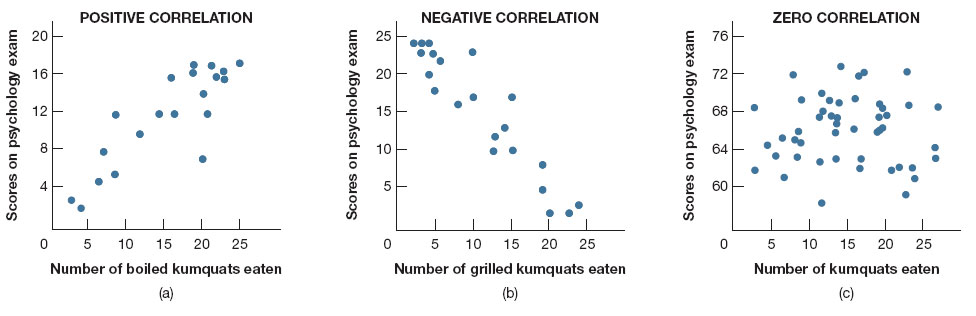
Graph (a) shows a positive correlation between scores on a psychology test and number of boiled kumquats eaten per month: The higher the score, the higher the number of kumquats. Graph (b) shows a negative correlation between test scores and number of grilled kumquats eaten: The higher the scores, the lower the number of kumquats. Graph (c) shows the reality—a zero correlation between kumquat-eating and test scores.
A negative correlation means that high values of one variable are associated with low values of the other. Figure2.5b shows a hypothetical negative correlation between scores on a psychology exam and number of grilled kumquats eaten per month. In general, the more kumquats eaten, the lower the test score. Here's another more realistic example: In general, the older adults are, the fewer miles they can run. How about hours spent watching TV and grade point averages? You guessed it; they're negatively correlated: Spending lots of hours in front of the television is associated with lower grades (Ridley-Johnson, Cooper, & Chance, 1983). See whether you can think of other variables that are negatively correlated. Remember that a negative correlation tells you that the more of one thing, the less of another. If no relationship exists between two variables, we say that they are uncorrelated (see Figure2.5c). Shoe size and IQ scores are uncorrelated.
The statistic used to express a correlation is called the correlation coefficient. This number conveys both the size of the correlation and its direction. A perfect positive correlation has a coefficient of +1.00, and a perfect negative correlation has a coefficient of −1.00. Suppose you weighed 10 people and listed them from lightest to heaviest, then measured their heights and listed them from shortest to tallest. If the names on the two lists were in exactly the same order, the correlation between weight and height would be +1.00. If the correlation between two variables is +.80, it means that they are strongly related. If the correlation is −.80, the relationship is just as strong, but it is negative. When there is no association between two variables, the coefficient is zero or close to zero.
Understanding Correlations
Cautions about Correlations
Correlational findings are common in psychology and often make the news. But beware: Many supposed “correlations” reported in the media or on the Internet are based on rumor and anecdote, and turn out to be small or meaningless. Some are merely illusory correlations, apparent associations between two things that are not really related. Illusory correlations can create dangerous beliefs and cause great social harm. Claims of an association between autism and vaccination for childhood diseases have alarmed many parents. The supposed culprit was thimerosal, a preservative used in childhood vaccines until 1999, and now contained in trace amounts in only a few. However, no convincing evidence exists that thimerosal is involved in autism. After this preservative was removed from most vaccines, the incidence of autism did not decline, as it would have if thimerosal were to blame. And study after study has failed to find any connection whatsoever (Mnookin, 2011; Offit, 2008). In one major study of all children born in Denmark between 1991 and 1998 (over a half million children), the incidence of autism in vaccinated children was actually a bit lower than in unvaccinated children (Madsen et al., 2002). The apparent link between vaccination and autism is almost certainly a coincidence, an illusory correlation, arising from the fact that symptoms of childhood autism are often first recognized at about the same time that children are vaccinated.
You can see why an understanding of correlations matters. In 2009, a special court set up to rule on lawsuits filed by parents of autistic children ruled that the evidence overwhelmingly failed to support an autism–vaccination link. But unfortunately, some parents who believe that vaccines caused their children's autism are resorting to useless and potentially dangerous treatments, such as supplements that remove metals from the body—along with essential minerals necessary for physical and mental development. And rates of measles and whooping cough, which can be fatal, are rising in children whose parents have refused to have them vaccinated.

The number of hours toddlers spend watching TV is correlated with their risk of being hyperactive a few years later. Does that mean TV-watching causes hyperactivity problems? Are there other possible explanations for this finding?
Even when correlations are meaningful, they can still be hard to interpret because a correlation does not establish causation. It is often easy to assume that if variable A predicts variable B, A must be causing B—that is, making B happen—but that is not necessarily so. A positive correlation has been found between the number of hours that children ages 1 to 3 watch television and their risk of hyperactivity (impulsivity, attention problems, difficulty concentrating) by age 7 (Christakis et al., 2004). Does this mean that watching TV causes hyperactivity? Maybe so, but it is also possible that children with a disposition to become hyperactive are more attracted to television than those disposed to be calm. Or perhaps the harried parents of distractible children are more likely than other parents to rely on TV as a babysitter. It's also possible that neither variable causes the other directly: Perhaps parents who allow their young kids to watch a lot of TV have attention problems themselves and therefore create a home environment that fosters hyperactivity and inattentiveness. Likewise, the negative correlation between TV-watching and grades mentioned earlier might exist because heavy TV-watchers have less time to study because they have some personality trait that causes an attraction to TV and an aversion to studying because they use TV as an escape when their grades are low … you get the idea.
And remember the opening story about testosterone dropping in men who become involved fathers? Many commentators were quick to assume that there was some evolutionary reason for the hormonal decline; perhaps it equips men for bonding to infants. But we think a simpler explanation is in order: When men (and women) are tired because of having many demands on their time from childcare and housework, libido flags and sex life slows down. Accordingly, so do hormones. Fatherhood itself probably has little to do with hormones; fatigue does!
The moral: When two variables are associated, one variable may or may not be causing the other.