2.5 Evaluating the Findings
If you are a psychologist who has just conducted an observational study, a survey, or an experiment, your work has just begun. After you have some results in hand, you must do three things with them: (1) describe them, (2) assess how reliable and meaningful they are, and (3) figure out how to explain them.
Descriptive Statistics: Finding Out What's So
Let's say that 30 people in the cell phone experiment talked on the phone, and 30 did not. We have recorded the number of collisions for each person on the driving simulator. Now we have 60 numbers. What can we do with them?
The first step is to summarize the data. The world does not want to hear how many collisions each person had. It wants to know how the cell phone group did as a whole compared to the control group. To provide this information, we need numbers that sum up our data. Such numbers, known as descriptive statistics, are often depicted in graphs and charts.
A good way to summarize the data is to compute group averages. The most commonly used type of average is the arithmetic mean, which is calculated by adding up all the individual scores and dividing the result by the number of scores. We can compute a mean for the cell phone group by adding up the 30 collision scores and dividing the sum by 30. Then we can do the same for the control group. Now our 60 numbers have been boiled down to two. For the sake of our example, let's assume that the cell phone group had an average of 10 collisions, whereas the control group's average was only seven.
We must be careful, however, about how we interpret these averages. It is possible that no one in our cell phone group actually had 10 collisions. Perhaps half the people in the group were motoring maniacs and had 15 collisions, whereas the others were more cautious and had only 5. Perhaps almost all the participants in the group had 9, 10, or 11 collisions. Perhaps the number of accidents ranged from 0 to 15. The mean does not tell us about such variability in the participants' responses. For that, we need other descriptive statistics. The standard deviation tells us how clustered or spread out the individual scores are around the mean; the more spread out they are, the less “typical” the mean is. (See Figure2.8.) Unfortunately, when research is reported in the news, you usually hear only about the mean.
Figure2.8
Same Mean, Different Meaning
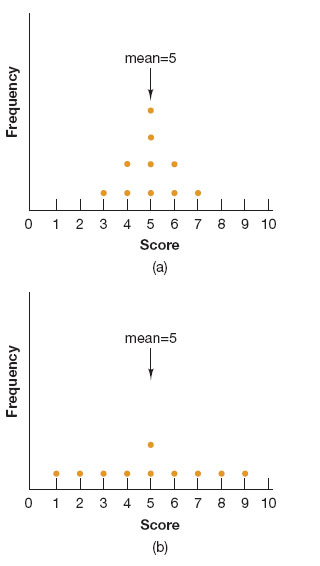
In both distributions of scores, the mean is 5, but in (a), the scores are clustered around the mean, whereas in (b), they are widely dispersed, so the standard deviations for the distributions will be quite different. In which distribution is the mean more “typical” of all scores?
Inferential Statistics: Asking “So What?”
At this point in our study, we have one group with an average of 10 collisions and another with an average of seven, a difference of three collisions. Should we break out the champagne? Hold a press conference? Call our mothers?
Better hold off. Perhaps if one group had an average of 15 collisions and the other an average of one, we might get excited. But rarely does a psychological study hit you between the eyes with a sensationally clear result. In most cases, the difference between the two groups is due simply to chance. Despite all our precautions, perhaps the people in the cell phone group just happened to be a little more accident-prone, and their extra three collisions had nothing to do with talking on the phone.
To find out how impressive the data are, psychologists use inferential statistics. These statistics do not merely describe or summarize the data; they permit a researcher to draw inferences (conclusions based on evidence) about how meaningful the findings are. Like descriptive statistics, inferential statistics involve the application of mathematical formulas to the data.
Historically, the most commonly used inferential statistics have been significance tests, which tell researchers how likely it is that their result occurred by chance. (We have given you the general meaning; statisticians use a more technical one.) Suppose that in the real world, people who talk on cell phones have no more collisions than people who do not. How likely, then, would you be to obtain the difference you found (or an even larger one) between the experimental group and the control group? If that likelihood is quite low, we reject the hypothesis that there is no difference in the real world, and we say that our result is statistically significant. This means there is a good probability that the difference we got in our study is real.
Psychologists consider a result to be significant if it would be expected to occur by chance only rarely, and “rarely” usually means five or fewer times in 100 repetitions of the study. We would then say that the result is significant at the .05 level, or p <.05, where p stands for probability and .05 is referred to as the p value. If, however, the significance test shows that the p value is greater than .05, many researchers would have little confidence in the study's result, although they might still want to do further research to confirm their judgment.
Statistically significant results allow psychologists to make general predictions about human behavior: “Talking on a cell phone while driving increases people's risk of accidents.” But these predictions do not tell us with any certainty what a particular person will do in a particular situation. Probabilistic results are typical in all of the sciences, not just psychology. Medical research can tell us that the odds are high that someone who smokes will get lung cancer, but because many variables interact to produce any particular case of cancer, research cannot tell us for sure whether Aunt Bessie, who smokes two packs a day, will come down with the disease.
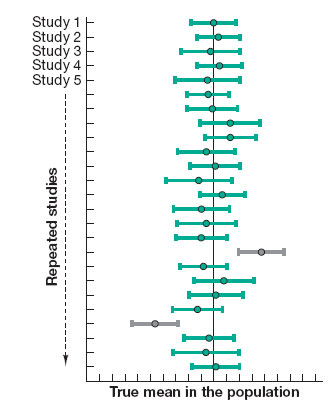
Today, a growing number of psychologists and other researchers also report their results by using a statistical formula that creates a confidence interval. The mean from a particular sample will almost never be exactly the same value as the true mean in the population; instead, it will probably be a little higher or a little lower. A confidence interval draws a range a little higher and lower than the sample mean to help depict where the true mean probably lies (Fidler & Loftus, 2009). As Figure2.9 shows, if you repeated your study over and over, you would produce a different sample mean and confidence interval each time. But notice something interesting: Although none of the means in each study (the green circles) is exactly the same as the population mean (the straight vertical line), most of the confidence intervals (CIs) contain the true mean. In fact, if you repeated your study over and over, 95 percent of the CIs would contain the true mean, although you would occasionally produce a rogue CI (the gray bars) (Cumming, 2014). So do you see the problem with drawing strong conclusions on the basis of any one study?
Figure2.9
Confidence Intervals across Repeated Studies
By the way, many studies similar to our hypothetical one have confirmed the dangers of talking on a cell phone while driving. In one study, cell phone users, whether their phones were hand-held or hands-free, were as impaired in their driving ability as intoxicated drivers were (Strayer, Drews, & Crouch, 2006). Because of such research, some states have made it illegal to drive while holding a cell phone to your ear. Others are considering making any cell phone use by a driver illegal.
Distinguishing Descriptive and Inferential Statistics
Interpreting the Findings
The last step in any study is to figure out what the findings mean. Trying to understand behavior from uninterpreted findings is like trying to become fluent in Swedish by reading a Swedish–English dictionary. Just as you need the grammar of Swedish to tell you how the words fit together, psychologists need hypotheses and theories to explain how the facts that emerge from research fit together.
Choosing the Best Explanation Sometimes it is hard to choose between competing explanations of a finding. Does cell phone use disrupt driving by impairing coordination, by increasing a driver's vulnerability to distraction, by interfering with the processing of information, by distorting the driver's perception of danger, or by some combination of these or other factors? Several explanations may fit the results equally well, which means that more research will be needed to determine the best one.

Trying to operate a car and operate a cell phone simultaneously can be a recipe for disaster.
Sometimes the best interpretation of a finding does not emerge until a hypothesis has been tested in different ways. Although the methods we have described tend to be appropriate for different questions (see Review2.2), sometimes one method can be used to confirm, disconfirm, or extend the results obtained with another. If the findings of studies using various methods converge, researchers have greater reason to be confident about them. If the findings conflict, researchers must modify their hypotheses or investigate further.
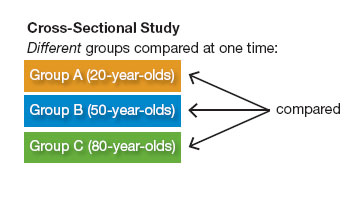
Here is an example. When psychologists compare the mental test scores of young people and old people, they usually find that younger people outscore older ones. This type of research, in which different groups are compared at the same time, is called a cross-sectional study.
But longitudinal studies can also be used to investigate mental abilities across the lifespan. In a longitudinal study, the same people are followed over a period of time and are reassessed at regular intervals.
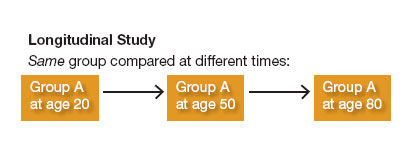
In contrast to cross-sectional studies, longitudinal studies find that as people age, they sometimes perform as well as they ever did on certain mental tests. A general decline in ability may not occur until people reach their 70s or 80s. Why do results from the two types of studies conflict? Probably because cross-sectional studies measure generational differences; younger generations tend to outperform older ones in part because they are better educated or are more familiar with the tests used. Without longitudinal studies, we might falsely conclude that all types of mental ability inevitably decline with advancing age.
Judging the Result's Importance Sometimes psychologists agree on the reliability and meaning of a finding but not on its ultimate relevance for theory or practice. Part of the problem is statistical. Traditional tests of significance continue to be used in the majority of psychological studies, which is why we have described them here, but these tests have important drawbacks (Cumming, 2014; Cumming et al., 2007; Erceg-Hurn & Mirosevich, 2008). A result may be statistically significant yet be small and of little consequence in everyday life because the independent variable does not explain most of the variation in people's behavior. Moreover, p values don't guarantee that other researchers (or even the same researchers) will be able to obtain a similar effect if they run their study again; in fact, p values can vary considerably from one replication to another (Cumming, 2014). That is why so many “findings” that make the news don't pan out in later studies. Remember the ESP study that we mentioned at the start of this chapter? Because the results were just barely statistically significant, the paper was published in an academic journal, which appalled many psychological scientists (Alcock, 2011). As one statistician noted, the article did not show that ESP exists; rather, it showed why a reliance on p values produces too many results that are just flukes (in Miller, 2011).
To gain better protection against spurious, unsubstantial results, many psychology journals now encourage or require the use of alternate methods and statistics. One is to use statistical procedures that reveal the effect size. Think of effect sizes as similar to measuring how much something weighs: Regardless of what you're weighing, 100 pounds is weightier than 10 pounds. Effect sizes, then, help us to understand how important—how weighty—an effect is. One such measure tells us how much of the variation in the data the independent variable accounts for. If it explains 5 percent of the variation, it's not very powerful, even if the result is statistically significant; if it explains 40 percent, it's very impressive.
A popular set of statistical techniques called meta-analysis provides an especially good way to measure the overall “weight” of a finding because it combines data from a number of related studies instead of assessing each study's results separately. A single result based on a small sample may be just a coincidence; meta-analysis comes to the rescue, assessing the effect of some independent variable across all the studies in the analysis. This approach is important because rarely does one study prove anything, in psychology or any other field. That is why you should be suspicious of headlines that announce a sudden major scientific breakthrough based on a single study. Breakthroughs do occur, but they are rare.
Consider the gender gap in math achievement, which persists in some nations but not in others. Is it largely due to a “natural” male superiority in math, or to gender differences in educational and professional opportunities in the sciences? A meta-analysis of studies across 69 nations, representing nearly 500,000 students ages 14–16, found that although boys have more positive attitudes toward math than girls do, average effect sizes in actual mathematics achievement are very small. Moreover, national effect sizes show considerable variability; that is, a male–female math gap is wider in some countries than in others. The most powerful predictors of that cross-national variation were whether boys and girls were equally likely to be enrolled in school; the percentage of women in research jobs; and women's representation in their nation's government (Else-Quest, Hyde, & Linn, 2010).
Another approach, growing in popularity among scientists in medicine and other fields as well as psychology, is based on Bayesian statistics, named for the 18th-century English minister who developed it (Dienes, 2011; McGrayne, 2011). Bayesian statistics involve a formula that takes prior knowledge into consideration when evaluating any finding. In the case of ESP, “prior knowledge” of physics and biology suggests no known or possible mechanism for this phenomenon. And in fact, when a team of mathematical psychologists reassessed the ESP paper using Bayes's formula, they concluded that the data actually support the hypothesis that ESP does not exist (Wagenmakers et al., 2011).
One writer nicely summarized the Bayesian approach as the “yeah, right” effect. If a study finds that eating blueberry muffins reduces the risk of heart disease by 90 percent or that a treatment cures drug addiction in a week, a Bayesian's reaction would be to evaluate that finding against what can be observed in the real world, and the result would have to pass the “yeah, right” test of plausibility (Carey, 2011). A team of researchers compared p values, effect sizes, and Bayes factors as measures of statistical evidence, using 855 published findings (Wetzels et al., 2011). They found that although p values and Bayes factors almost always agreed about which hypotheses were better supported by the data, the measures often disagreed about the strength of this support. In many cases, the Bayes analysis showed that the result was only anecdotal.
The Bayesian approach is still controversial, and arguments continue about how precisely to quantify “prior knowledge,” which can vary from strong empirical evidence to more subjective estimates. But its importance is growing among the statistical methods of science.
Review2.2 presents an overview of the various psychological research methods we have learned about in this chapter. In the next section, we'll look at ethical issues relating to psychological research.
Review2.2
Reviewing Psychological Research Methods