4.3
Mapping the Brain
We come now to the main room of the nervous system “house”: the brain. A disembodied brain stored in a formaldehyde-filled container is a putty-colored, wrinkled glob of tissue that looks a little like an oversized walnut. It takes an act of imagination to envision this modest-looking organ writing Hamlet, discovering radium, or inventing the telephone. In a living person, of course, this astonishing organ is encased in a thick protective vault of bone. How, then, can scientists study it?
One approach is to study patients who have had a part of their brain damaged or removed because of disease or injury. Another is to stimulate the brains of patients who are having brain surgery to try to identify the functions of various areas. But both of these methods rely on accidents of nature; for one reason or another, the brains of the people in these studies are not healthy. Fortunately, neuroscientists have a growing number of other tools that they can use to study healthy brains in action. We will discuss two broad approaches to mapping the brain. In the first, neuroscientists do something that temporarily affects particular brain areas and then observe the consequences for behavior; in the second, they manipulate behavior in some way and then record the effects in the brain.
Intervening in the Brain and Observing Behavior
When researchers work with animals, they sometimes surgically remove or disable a brain structure and then observe the effects on behavior. This approach is called the lesion method, and, unlike studies of patients with brain damage, it gives scientists a high level of control over the affected brain regions. Of course, the lesion method cannot be used on humans.
Transcranial magnetic stimulation (TMS) is a recent method that creates a “virtual” lesion—a temporary one that does not involve removing or permanently disabling brain tissue. It delivers a large current through a wire coil placed on a person's head. The current produces a magnetic field about 40,000 times greater than the earth's natural magnetic field, causing neurons under the coil to fire. Although TMS can be used to produce motor responses, such as a thumb twitch or a knee jerk, researchers can also use it to briefly inactivate an area and observe the effects on behavior. The drawback is that when neurons fire, they cause many other neurons to become active too, so it can be hard to tell which neurons are critical for a particular task. Still, TMS has been useful for examining the role of various brain regions in everything from vision to emotion to language (van deRuit, Perenboom, & Grey, 2015). As we will see, the left hemisphere of the brain plays a significant role in language, but TMS shows that the right side is important as well. TMS over the right hemisphere causes people to lose the ability to understand metaphors (“a blanket of snow”); although they still understand the individual words in the metaphor, they no longer can see the relationship between them (Pobric et al., 2008).
Transcranial direct current stimulation (tDCS) is an even newer way of studying brain function. The researcher applies a very small electric current to an area of the cortex, the outer surface of the brain (Cohen Kadosh, 2015). Depending on the direction of the current, brain activity in that area is either temporarily stimulated or suppressed. In one study, applying current in one direction increased activity, improving people's memory for the information they gained during one task while they focused on doing another. But applying the current in the other direction, which reduces activity, reduced their ability to do this task (Zaehle et al., 2011).
Mapping the Brain
Intervening in Behavior and Observing the Brain
The second general approach to mapping the brain is to do something that affects behavior and then record what happens in the brain. One recording method uses electrodes, devices pasted or taped onto the scalp to detect the simultaneous electrical activity of millions of neurons in particular brain regions. Wires from the electrodes are connected to a machine that translates the electrical energy from the brain into wavy lines on a moving piece of paper or a screen, which is why electrical patterns in the brain are known as “brain waves.” The brain-wave recording itself is called an electroencephalogram (EEG). A standard EEG is useful but not very precise because it reflects the activities of so many cells at once. “Listening” to the brain with an EEG machine is like standing outside a sports stadium: You know when something is happening, but you can't be sure what it is or who is doing it.
One solution is a variation of EEG that uses statistical techniques to measure event-related potentials (ERP), waves of electrical activity associated with particular stimuli (“events”) such as seeing a picture or hearing a word. Any thought you have is made up of a series of different steps, and ERP allows scientists to see the neural activity associated with each step—in real time, as Figure4.7 shows.
Figure4.7
An Event-Related Potential (ERP)
Even using ERP, scientists still cannot know exactly where in the brain the activity occurs, but they know when it occurred—much like knowing that one player has thrown a ball and another has caught it, but not precisely where they were when all the action happened. ERP is also useful in studying infants and other people who cannot follow instructions in an experiment. For example, scientists have used ERP to compare how infants exposed to one language differ from infants exposed to two languages. Monolingual infants raised in English-speaking households showed different ERPs for English and Spanish as early as 6 months old, suggesting they could distinguish the two languages and were more receptive to English. But bilingual infants did not show this ability to distinguish between languages until they were 10 to 12 months old, showing that their brains were equally receptive to both English and Spanish (GarciaSierra et al., 2011).
Yet another method, the PET (positron emission tomography) scan, records biochemical changes in the brain as they are happening. One type of PET scan takes advantage of the fact that nerve cells convert glucose, the body's main fuel, into energy. A researcher can inject a person with a glucose-like substance that contains a harmless radioactive element. This substance accumulates in brain areas that are particularly active and are therefore consuming glucose rapidly. The substance emits radiation, which is detected by a scanning device, and the result is a computer-processed picture of biochemical activity on a display screen (see Figure4.8a). Other kinds of PET scans measure blood flow or oxygen consumption, which also reflect brain activity. Today PET scans are mostly used in medical research and diagnosis.
Figure4.8
Scanning the Brain
In psychological research, PET scans have largely been superseded by magnetic resonance imaging (MRI), which uses powerful magnetic fields and radio frequencies to take highly detailed pictures of the brain. The magnets produce vibrations in the nuclei of atoms in the body's organs. The vibrations are then detected as signals by special receivers. A computer analyzes the signals, taking into account their strength and duration, and converts them into a high-contrast picture of whatever organ the scientist or physician is interested in, such as the brain. This is a structural MRI (see Figure4.8b). It gives us a terrific picture of what the brain looks like, but not what it does. Another version of MRI, called functional MRI (fMRI), allows us to see brain activity associated with specific thoughts or behaviors that last at least several seconds (see Figure4.8c). In fMRI, the receivers detect levels of blood oxygen in different brain areas. Because neurons use oxygen as fuel, active brain areas produce a bigger signal.
Functional MRI can localize brain activity; it can tell where something is happening, but not when it is happening (just the opposite strengths and weaknesses of the EEG). Because all of your brain is active all of the time, scientists who use fMRI must compare the activity in the brain when people are engaged in control tasks and when they are engaged in experimental tasks. In one condition, people might read nonsense words (like “glorp”) and in another condition real words. In both cases, people are seeing and identifying letters, but they are comprehending only the real words. By “subtracting” one brain image from the other, it is possible to identify the brain regions involved in comprehension. Researchers are using fMRI to study everything from racial attitudes to moral reasoning to spiritual meditation.
Controversies and Cautions Exciting though these developments and technologies are, we need to understand that technology cannot replace critical thinking (Legrenzi & Umiltà, 2011; Tallis, 2011; Wade, 2006). As one team of psychological scientists who use fMRIs to study cognition and emotion wrote, “Just because you're imaging the brain doesn't mean you can stop using your head” (Cacioppo et al., 2003). Because brain-scan images seem so “real” and scientific, many people fail to realize that these images can convey oversimplified and sometimes misleading impressions (see Figure4.9). Simply by coloring various regions, researchers can make small contrasts look dramatic, and larger ones seem insignificant (Dumit, 2004). Combining individual brain scans into one average scan—a common practice—can mask significant variability among people's brains.
Figure 4.9
Coloring the Brain
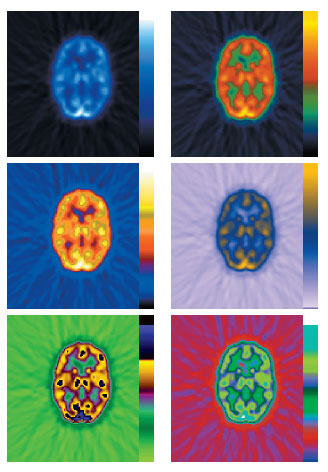
By altering the colors used in brain images, such as in this PET scan, researchers can create the appearance of dramatic brain differences. These scans are actually images of the same brain.
Furthermore, simply including an image of brain activity can be enough to make a study's conclusions seem more “scientifically reasoned” even when they are not. To illustrate this point, scientists asked people to read some scientific-sounding nonsense. For instance, one passage explained that because watching television and doing math problems both caused activation in the temporal lobe, watching television would improve math skills! (This conclusion is, of course, rubbish.) Some people read a version of the passage featuring no accompanying image, and others read the passage featuring either a bar graph of the results or an image of the brain, such as from an fMRI. People who read the version of the passage with the brain images thought it had much better scientific reasoning than did those who read the version with no images, or even the version with the graph (McCabe & Castell, 2008).
Research using fMRI has also sometimes suffered from questionable statistical procedures that have produced highly inflated correlations between brain activity and measures of personality and emotion (Vul et al., 2009). Yet the press usually reports these findings uncritically, giving the impression that psychological scientists know more about the relationship between the brain and psychological processes than they really do. One clever group of scientists made this point very well by doing an fMRI on a dead Atlantic salmon while asking it to view emotional images and determine what emotions the person in each photo was feeling (Bennett et al., 2010). We know what you're thinking: The salmon is dead, so why would the fMRI detect any brain activity? You're right. Why would it? But it did. The scan revealed that the salmon was “thinking” about the pictures and the people in them. That's because fMRI produces a mix of signal and noise, like trying to track a conversation in a crowded bar. Scientists have to use sophisticated techniques to “quiet” the noise and reveal the true signal. If they don't know what they are doing, they can make errors. In this case, the result is funny because we know the salmon is dead. But in real life, too, we may not know if the result is real . . . or another dead fish.
The problem is not with fMRI as a technology so much as it is with bad theories, poorly defined dependent measures, and inappropriate interpretations of results, all of which have produced a mountain of dubious findings. The enthusiasm for technology has generated the widespread belief that specific “brain centers” or “critical circuits” explain why you prefer Coke to Pepsi, why you identify as a liberal or a conservative, or what your brain is doing when you are in love. These beliefs are certainly appealing because they explain complicated behavior in simple terms (Beck, 2010). But the attempts to reduce complex behavior to single locations in the brain will almost certainly fail, just as phrenology failed (Gonsalves & Cohen, 2010; Tallis, 2011; Uttal, 2001). As clinical neuroscientist Raymond Tallis put it, “Love is not like a response to a single stimulus, such as a picture. It's not even a single enduring state, like being cold. It is a many splendored and many miseried thing” that includes jealousy, kindness, lust, guilt, happiness, fury, and moments of not feeling in love at all (quoted in Parry, 2011). So if you know that one part of the brain is activated when you are thinking hot thoughts of your beloved, what exactly do you know about love—or your brain? Is the same part activated when you are thinking about a luscious fudge brownie?
Regardless of whether neuroscientists manipulate different brain areas to determine how behavior is affected or manipulate behavior and then record the effects in the brain, their studies are just one step in understanding brain processes and must be interpreted with great caution. Nonetheless, when used appropriately, they do provide an illuminating look at the brain at work and play, and we will therefore report many findings from brain-scan research throughout this text. For scientists, the brain can no longer hide behind the thick fortress of the skull.